

With the benefit of hindsight, April and May of 2020 in New Zealand look to be the poorest performing rent collection months across the last 3 years, regardless of the asset class. However, rent collection statistics suggest that this downturn may have subsided already for New Zealand.
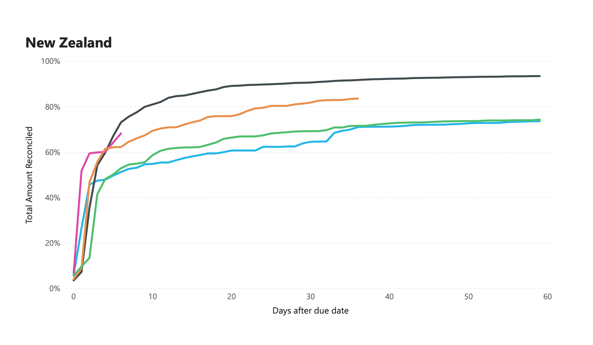
Both June and July of 2020 have seen businesses return to relative levels of normality in NZ and subsequently have provided significant improvements in rent collections since the lockdown measures were enforced. Whilst rent payments in June (80%) have failed to return to the levels of 2019 and before (an average of 90%), they are suggesting that the majority of pain for landlords and their cash flow may have passed.
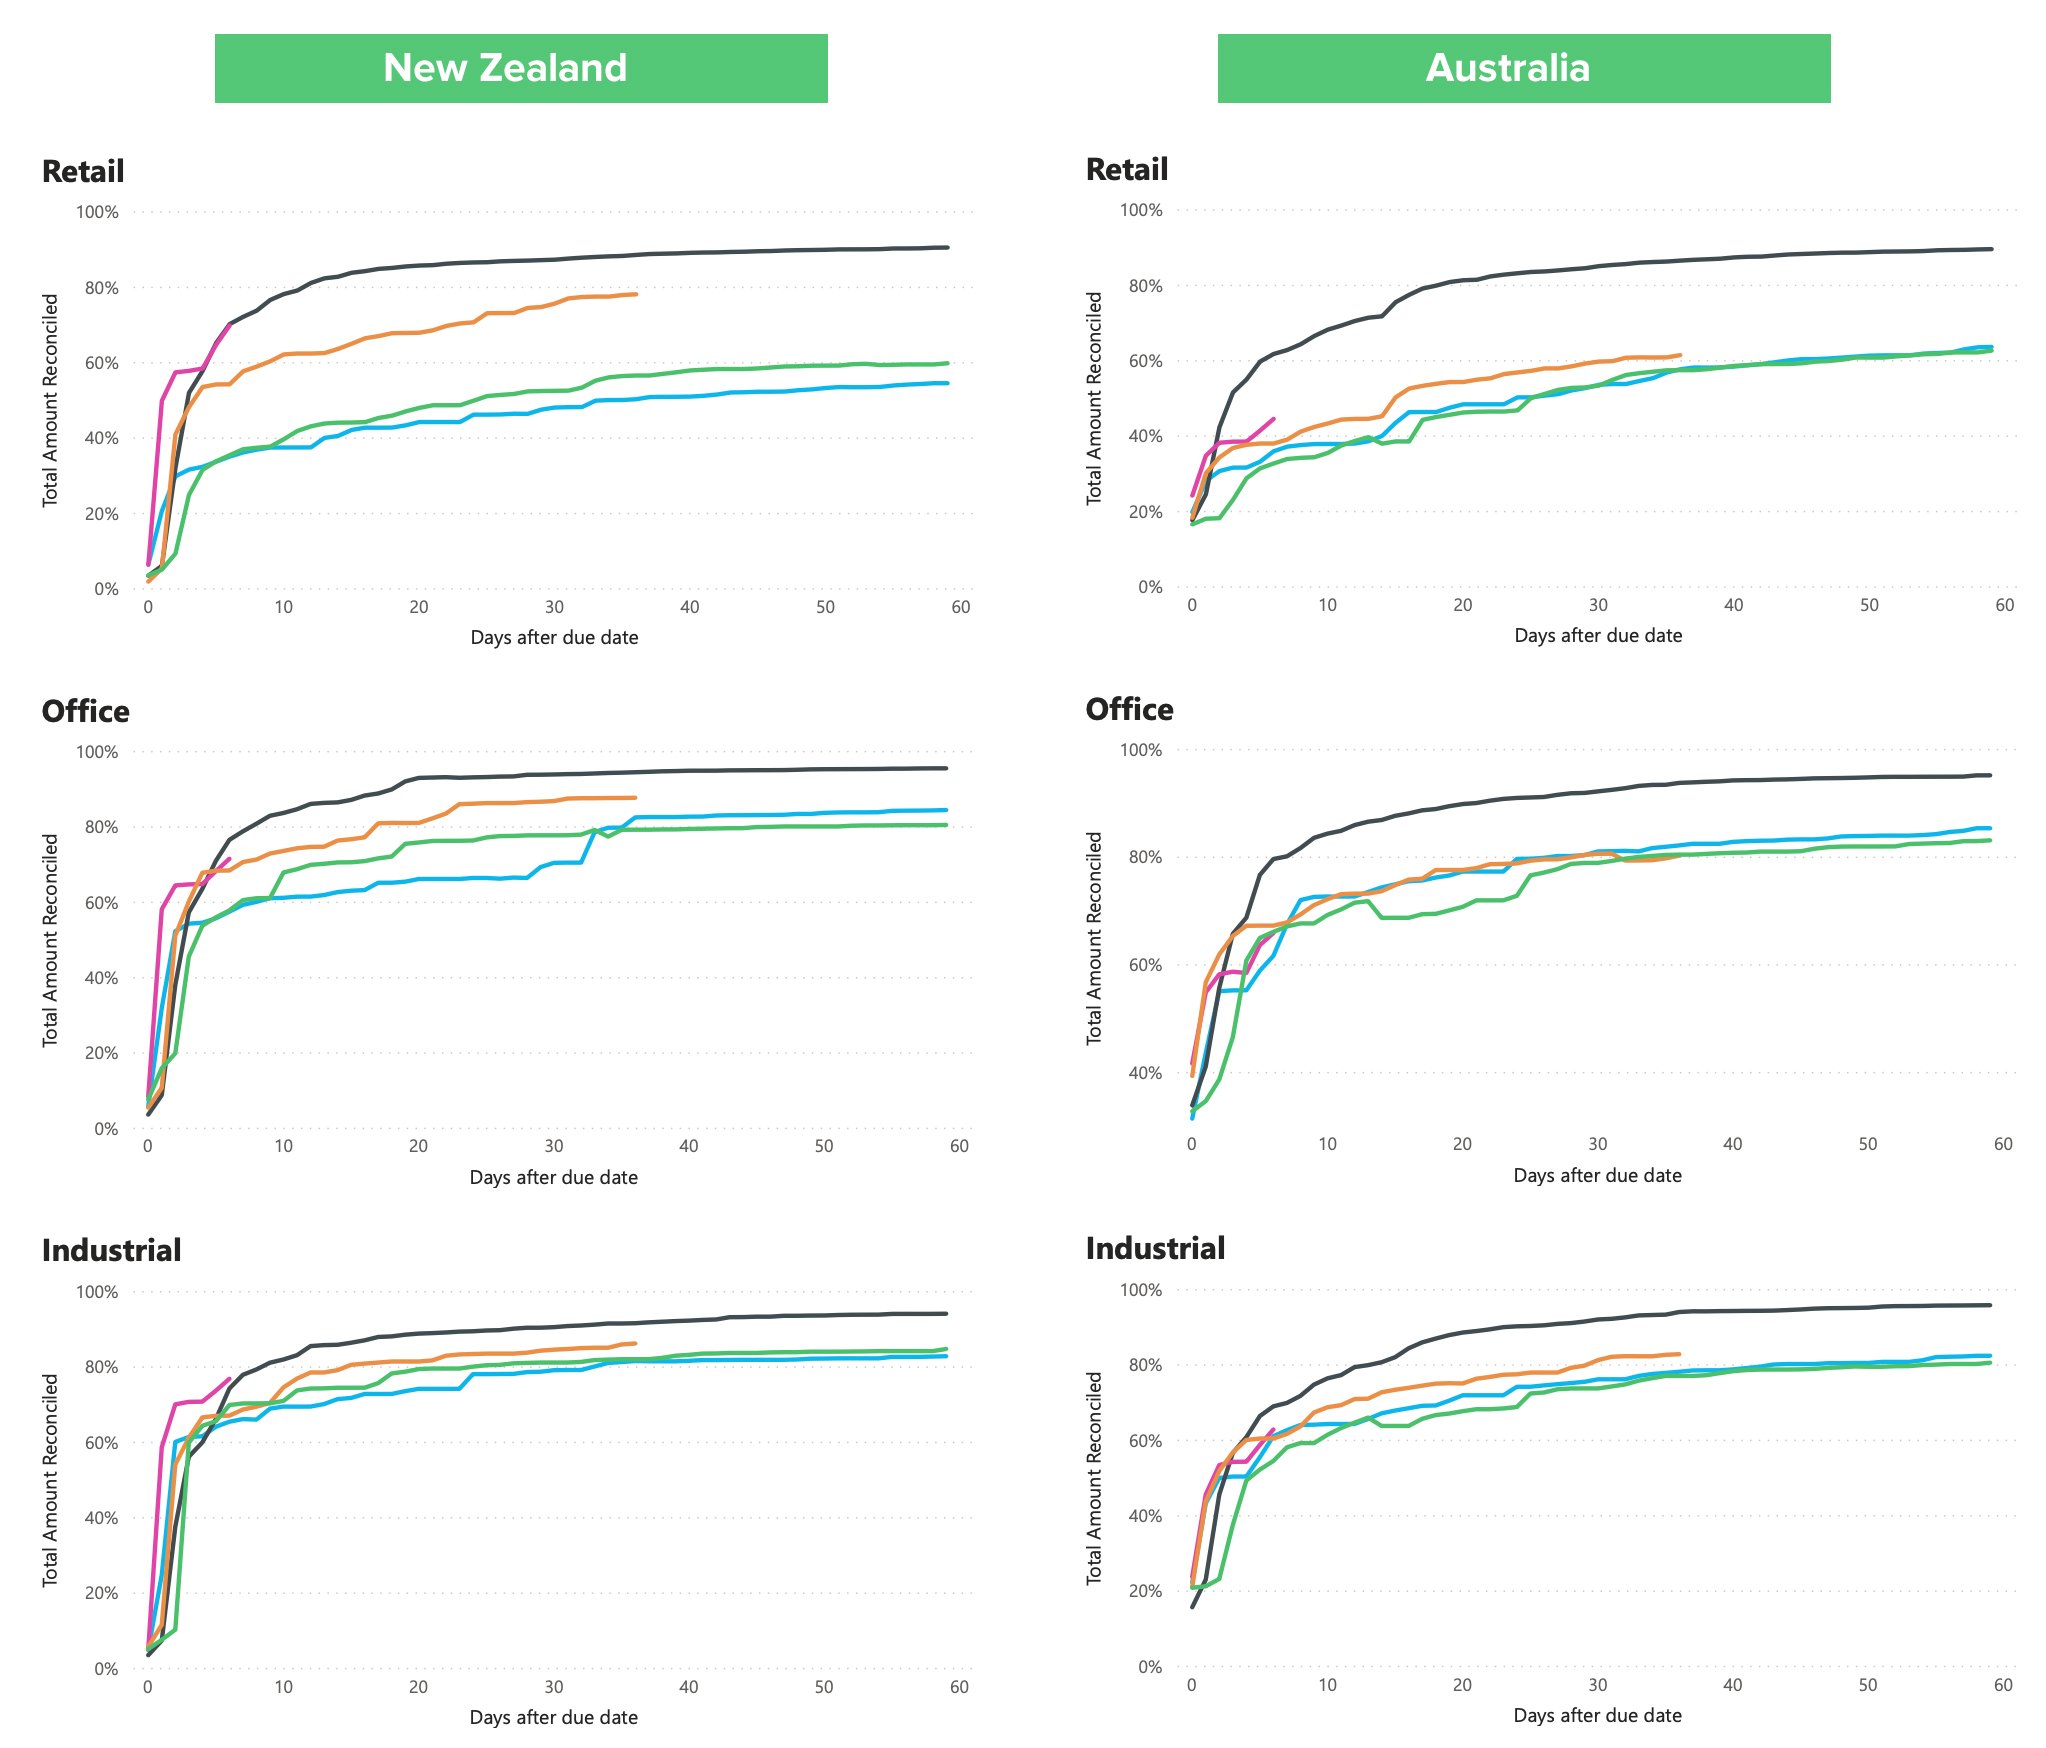
The greatest improvements experienced in the last 2 months when compared to April and May can largely be attributed to the increased cash received from retail tenants. After hovering around the 60% collection in the level 3 and 4 lockdown periods, retail rent collection has climbed back up to 80% in June while collections are trending even higher for the early part of July. Whilst still early in the month of July, there are strong signals that retail rent payments will be at their highest since April (70% of retail rent had already been collected after just 6 days of being due).
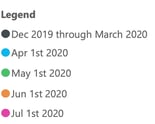
Rent collection across all sectors in Australia looks to have improved slightly since the debut of COVID-19 in March but still has a lot of ground to make up to match the average collection rates that landlords may have expected if they are using the last 2 years of performance as a gauge.
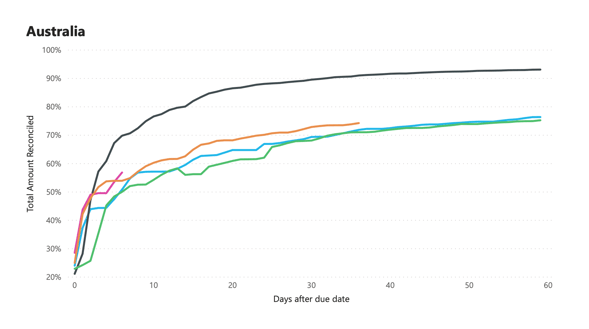
In New Zealand, industrial and office occupiers have not demonstrated payment delinquencies to the same extent as retail, but have shown signs of distress throughout lockdown in New Zealand. Rent collection in the early part of July, trends very close to the historic average payment averaged from the last 2 years for both asset classes. By the 6th of July, industrial rent paid sits at 77% compared to a 2-year benchmark of 74% and office rent is at 72% relative to a 77% benchmark.
In Australia, retail occupiers have continued to struggle to meet their rental obligations. By the conclusion of June, 58% of rent had been collected, contrasted to a typical 84% collection rate which has been the norm for this asset class.
The marginal increases in rent collection from April suggest that Australian landlord woes are set to persist. Rent collection by the 6th of July sits at 57% across the nation, indicating that the trend of modest month-on-month improvements continues. A small win for landlords has manifested in the slight flattening and decline in credit allocations for tenants. Statistics for early July suggest that around 2% less rent is being credited compared to the month before. Landlords will be hoping that this translates to greater cash being received from tenants and a positive sign that the regularity of rent subsidies has relented.
| Period (day) | 6 | 13 | 20 | 27 | |||||||||||||
| Base | Apr | May | Jun | Jul | Base | Apr | May | Jun | Base | Apr | May | Jun | Base | Apr | May | Jun | |
| Industrial | 74% | 65% | 70% | 67% | 77% | 86% | 70% | 74% | 79% | 89% | 74% | 79% | 81% | 90% | 78% | 81% | 84% |
| Office | 77% | 58% | 58% | 68% | 72% | 86% | 62% | 70% | 75% | 93% | 66% | 76% | 81% | 93% | 67% | 78% | 86% |
| Retail | 70% | 35% | 35% | 54% | 70% | 82% | 40% | 44% | 63% | 86% | 44% | 48% | 68% | 87% | 46% | 52% | 73% |
| Overall | 73% | 51% | 53% | 62% | 68% | 85% | 57% | 62% | 71% | 89% | 61% | 66% | 76% | 90% | 63% | 69% | 80% |
| Credit Notes | 1.1% | 7.4% | 10.8% | 5.7% | 3.5% | 1.3% | 8.7% | 11.7% | 6.4% | 1.5% | 10.9% | 13.5% | 7% | 1.6% | 12.2% | 14.5% | 7.4% |
| Period (day) | 6 | 13 | 20 | 27 | |||||||||||||
| Base | Apr | May | Jun | Jul | Base | Apr | May | Jun | Base | Apr | May | Jun | Base | Apr | May | Jun | |
| Industrial | 69% | 61% | 55% | 61% | 63% | 80% | 66% | 66% | 71% | 89% | 72% | 68% | 75% | 91% | 75% | 74% | 78% |
| Office | 80% | 62% | 66% | 67% | 66% | 87% | 74% | 72% | 73% | 90% | 78% | 71% | 78% | 92% | 80% | 78% | 80% |
| Retail | 62% | 36% | 33% | 38% | 45% | 71% | 39% | 40% | 45% | 81% | 48% | 46% | 54% | 84% | 51% | 52% | 58% |
| Overall | 70% | 51% | 50% | 53% | 57% | 80% | 58% | 58% | 61% | 87% | 65% | 61% | 68% | 89% | 68% | 67% | 71% |
| Credit Notes | 1.2% | 4.5% | 5.2% | 6.8% | 4.2% | 1.3% | 5.1% | 7.5% | 7.3% | 1.5% | 5.6% | 7.8% | 7.8% | 1.6% | 6.2% | 8.7% | 8.2% |
Base refers to an aggregation and average of rental collection rates for invoices due on the first of each month between Dec 2019 through March 2020 (AUS and NZ)
This data has been collected, anonymised and aggregated directly from:
Over 21,000 properties and 40,000 tenancies in Australia
Over 10,000 properties and 30,000 tenancies in New Zealand
It does not rely on surveys or secondary collections. Re-Leased Software Company Ltd are confident in the validity of this data as its formation is a direct result of bank statements entries being matched and reconciled to rental invoices.